
Data means little on its own. Projects are always constantly evolving, and it’s difficult to know how it is progressing and where you should focus your efforts.
That’s one of the things that make reporting on projects—your milestone completion, weekly timesheets, or budget performance—so hard. You have to procure the relevant data, figure out how to make use of it, and then write about the inferences that can be made on data.
Wouldn’t it be awesome if you could make a dashboard that automatically transforms your Asana, Wrike, or Trello project data into crystal-clear, actionable insights?
With HappyFox BI, you can build the custom dashboard for each of your project teams. In this blog, let’s learn how you can leverage HappyFox BI to create meaningful project management dashboards for Wrike.

Wrike Dashboard using HappyFox BI
The Tools you need to Build a Customizable Dashboard for Wrike
Whether you’re a small business or an enterprise, there are two things you need to make a reporting dashboard: a modern business intelligence tool, and a data connector from the project management tool (Wrike).
There’s a wide range of BI tools and add-ons on the market like Wrike Analyze, Google Data Studio, or Tableau. You could even use spreadsheet software like Microsoft Excel to track project data, but it can offer only a list view, which is not the best form of representation.
HappyFox BI is the best tool for this job as it’s online and can pull in data from project management software without any custom export/import. It offers an intuitive user interface with a drag and drop, no-code visualization builder. With customizable user groups, project managers can decide who gets access to which report.

Create customizable reports for key stakeholders

Explore more on HappyFox BI offerings to add your custom widgets from your SaaS products – HappyFox Help desk, Salesforce, and Aircall to your dashboard as well.
Decide What to Include in the Project Dashboard
Now it’s time to start building your agile dashboard. The first step is to determine which metrics matter most. Almost any entity inside Wrike could be tracked. You can easily set up a report that tracks your project performance across your team members or pull up insightful milestone completion charts. But these metrics are meaningless if you don’t have a reason to track them.
So to get started, consider how your performance is measured. For a project to be considered a success, here are 4 key metrics (KPIs) that could be tracked:
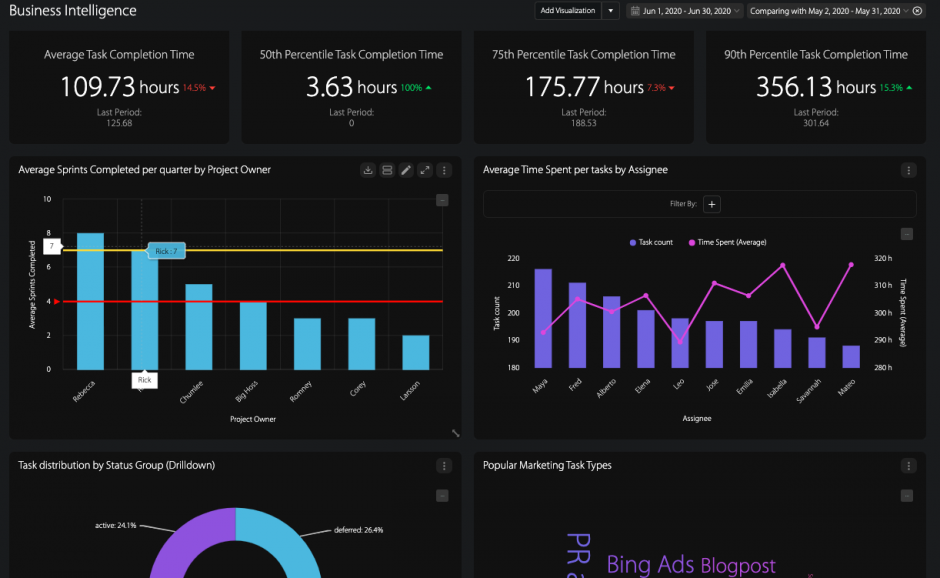
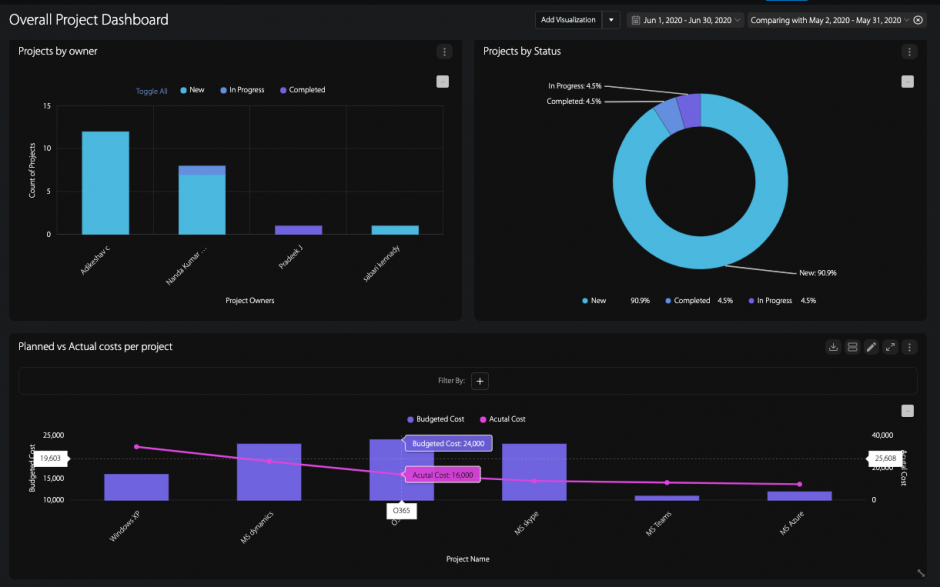
- Project Performance: Every project your team undertakes serves a unique goal. You can measure the success of your project deliverables by comparing the progress with our expected outcomes. Return on Investment (ROI), budget, and schedule being crucial metrics your team must track, having a report widget that acts as a tracker for these metrics will certainly benefit the project stakeholders. Reporting on individual task assignees will also help you uncover top performers and users who require additional training.

Sample Project Health Dashboard with key metrics
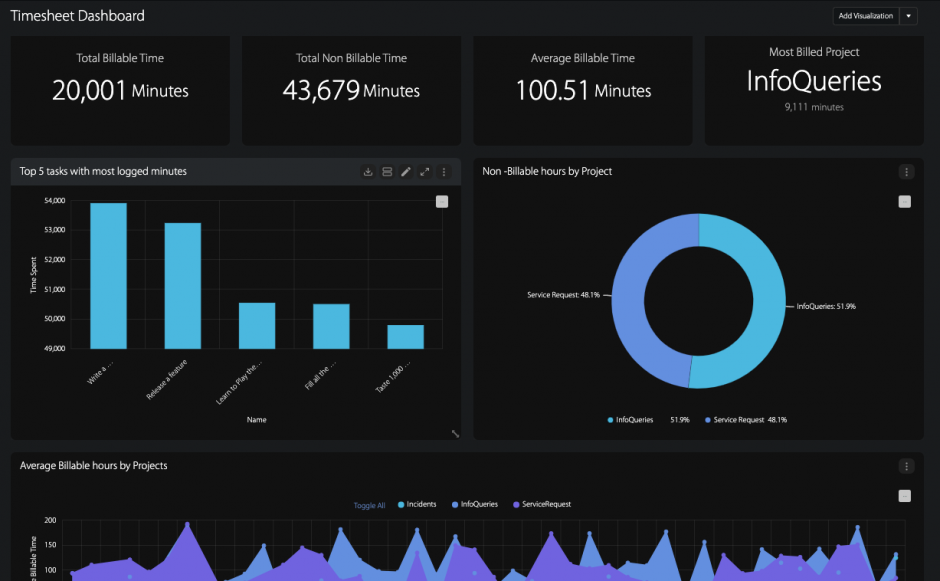
- Resource Utilization: The measure of how team members are spending their time while working on a project. It is the analysis of billable vs. non-billable time tracking activities. Usually, both these entities are compared with a line chart visualization. Billable utilization is an important concept for companies that make money by billing out resources (people) to customers. Your target utilization rate will vary based on your businesses and roles within those businesses.

Sample Timesheet Dashboard with Utilization related metrics
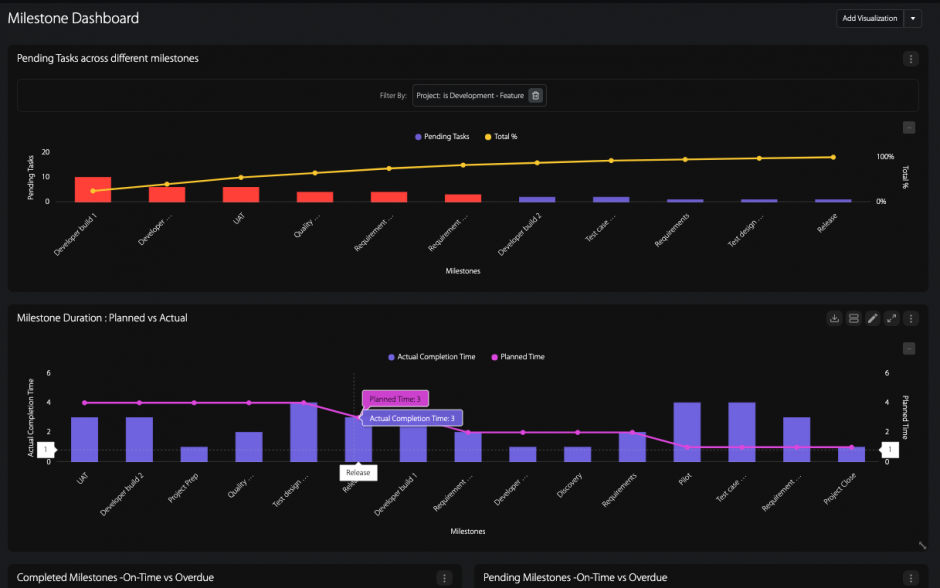
- Milestone Performance: Milestone is a KPI that is widely used in projects. It could mean you’ve overestimated your capacities and are running behind due dates or you’re doing just fine, never missing a milestone. It’s fine to overlook a couple of milestones during a long-term project process, but if it’s becoming a standard instead of the edge case, it may be a sign that you need to review the whole project process. A Gantt chart would help illustrate milestone completion and progress in a typical BI tool.

Sample Milestone Dashboard with advanced analysis like Pareto
- Task Completion Percentage: Every project has its own set of tasks and subtasks. Task management can get a bit overwhelming without keeping an eye on the project progress. To get a really quick overview of your task performance, it is recommended to have a real-time reporting dashboard with a KPI indicating the percentage of completed tasks. With this metric at hand, you’ll get more accurate insights and understand what phase your project actually stands. This means, new tasks are quickly picked up and backlog tasks are almost non-existent.

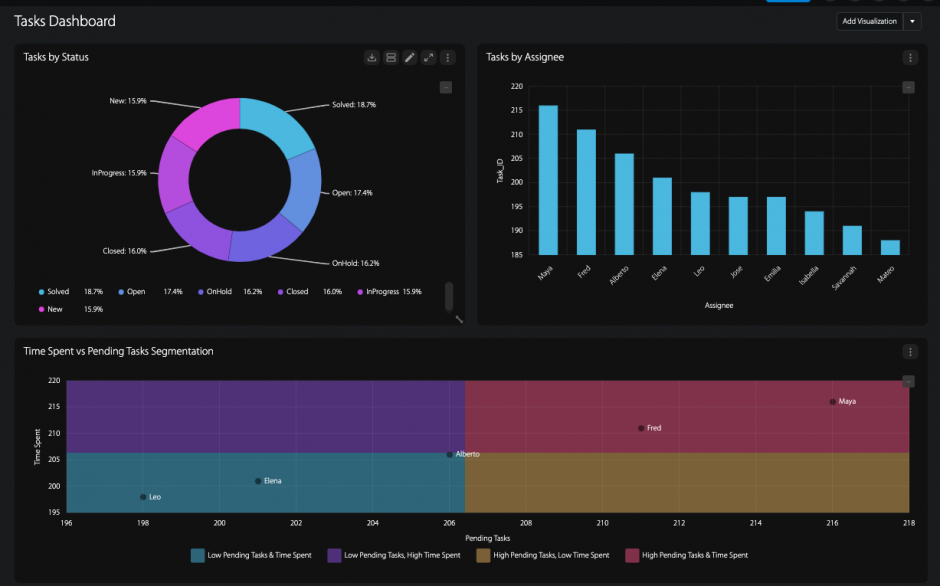
Sample Task Dashboard in Wrike : Highlighting key KPIs
Further Reading: Project management metrics that you must track
Tip: Using Wrike for Marketers and Wrike Proof to handle your inbound/outbound marketing? HappyFox BI for Wrike has over 25+ chart types to uniquely visualize your campaign and content progress and gather deep insights. Want to learn more? Book a demo.
Your team might have different metrics that are more important for your company. If so, decide which of those are most important, then add sections to the dashboard to track them as well.
Build a Reporting Dashboard in HappyFox BI
If you’re a project manager who’s looking to build insightful reports for Wrike, the first step to do is to install the Wrike app for HappyFox BI, if you haven’t already. Click here to know how to create your first dashboard for Wrike using HappyFox BI!