Every business today focuses on improving their “first response time”, the time elapsed between receiving an issue and sending the first response. Whether you are trying to answer a product inquiry, address a disappointed customer, or close a sales deal, responding fast could make all the difference. Let’s take a deeper look at the first response time, why you should measure it, and how to improve it.
Why Should You Measure First Response Time?
66% of customers say that valuing their time is the most important thing a company can do to provide good service.
Forrester
First response time is a critical customer support KPI you can’t overlook anymore, as it can help you improve customer satisfaction, increase conversions, and even win back customers all at once. First response times also drive brand trust.
- Customer experience: Customers don’t want to wait, especially when they have an issue. When you reply fast, you put them at ease and enable a friendly atmosphere for a mutually beneficial conversation.
- Brand trust: A quicker response time becomes critical when a customer is in the middle of a purchase decision or an issue. Having to wait could be the last straw for your customers. A fast reply could restore their trust and reassure their decision to do business with you.

It is not difficult to understand why customer #2 would have a much better experience than customer #1.
How Do You Calculate First Response Time?
Once a ticket is created, measure the time taken by an agent to add the first response to the ticket. You need to capture it at a ticket level.

Remember, automatic responses don’t count. A first response always refers to one made by a customer service representative.
Now that you have measured the first response time, you need to put it under the microscope and assess the response patterns. What leads to a delayed first response? Which agents respond the fastest and how do they manage to do that? You need these questions answered in order to guide your improvement efforts in the right direction. There are many ways to do that.
What is a Good First Response Time?
A good FRT varies depending on what channel your customer chooses to contact you in and even when to contact you. Exceptional first response time can be 45 seconds or below for live chat and 4 hours or below for email or social media. 53% of customers think three minutes is a reasonable time to wait on the phone call for a support agent.
FRT also differs from industry to industry. A highly competitive first response time in one industry can be a norm in the other. For example, the industry average email FRT for real estate is 15 hours, e-commerce is 17 hours, and financial services is 14 hours. Understanding your industry benchmarks and setting realistic FRT goals for each channel is key.
5 Steps to Measure & Improve Your First Response Time
1. Find Which Tickets Get Delayed Responses
One way to find the root cause of slow response times is to analyze the ticket response times by multiple attributes: Type of the incoming ticket, assignee of the ticket, location, function, module, priority, complexity, support channels, and any other attribute you capture when a ticket is created. You can use attribute-wise analysis to gain deeper visibility into your response times.
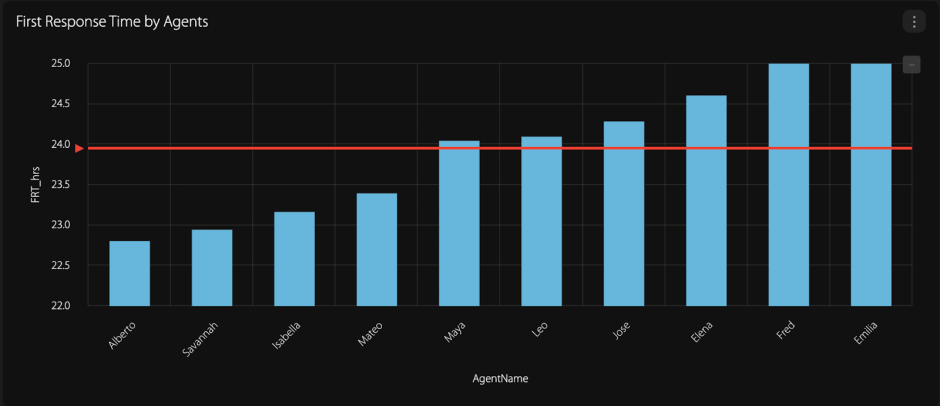
All tickets are created equal but not all responses; you may prioritize a product inquiry or a high-level ticket over a simple query. The analysis will help you streamline and improve this process of triaging tickets and, in turn, improve the response times.
You can leverage the results to inform many important decisions:
- Identify support reps who typically respond slow.
- Check if high-level tickets are getting immediate attention.
- Deep dive into functions, tickets, and channels that receive the most delayed first responses.
- Design an effective workflow to triage incoming tickets based on priority.
2. Get a Statistical Perspective of Your First Response Time
The next step is to go beyond the averages and measure the number of hours or even minutes upon which you send your first responses. It is critical to understand this KPI beyond the average time. While the average first reply times in a particular timeframe give you an introductory perspective, understanding statistical measures like standard deviation and coefficient of variation gives you the drilled-down insights you need to drive specific improvements.

Indeed, an average response time is easily comparable with industry benchmarks. But statistical measurements can give you a microanalytical perspective of first response times from the average value. For instance, a lower coefficient of variant indicates a systematic process of agents in responding to customers.
Tools like HappyFox Business Intelligence can help you get a statistical perspective into data and perform deeper analytics.
3. Know Your Outliers
Once you have calculated the first response time, you need to understand its distribution across service requests. Let’s take an example.

Response time is typically measured in hours. If you were to know the ticket count for each 4-hour interval of the first response time, the above histogram would help you with it. In this example, tickets receive responses within 4-8 hours or 8-12 hours. However, what you can also calculate is the count beyond the 16-hour limit. This gives you an insight into the outliers that exist.
You can see the actual tickets being responded to over 16 hours. This helps you understand special cases and make better decisions when committing to service-level agreements (SLA).
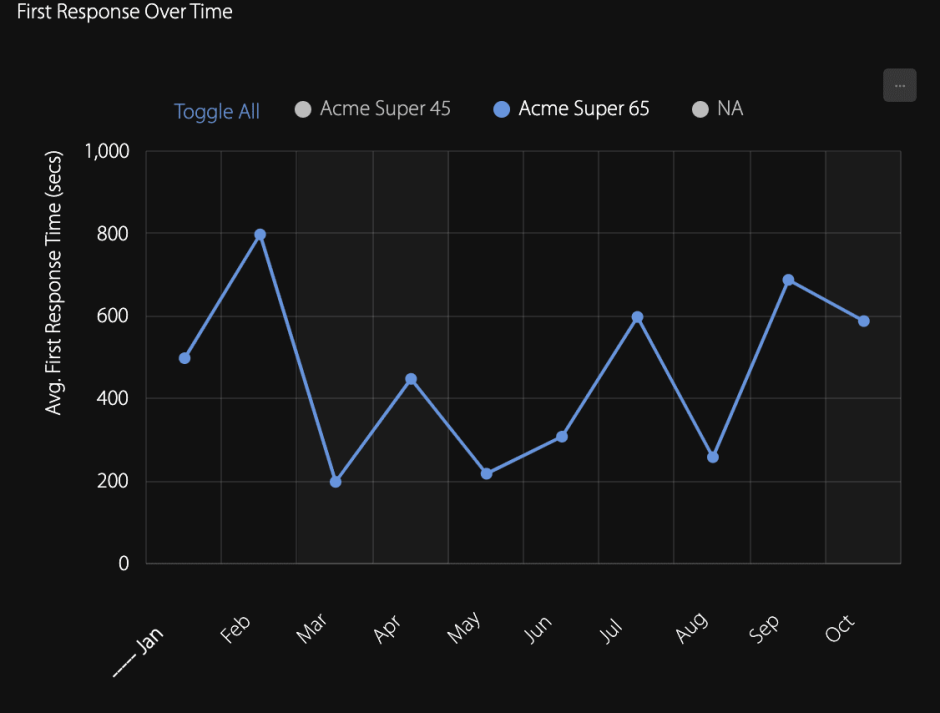
4. Find When You Respond the Slowest
As you begin to manage larger teams, you need to ensure that your teams working in different shifts consistently maintain the response SLA. You can get started by analyzing the first response time with 2 dimensions: the hour of the day and the ticket volume.

The above graph shows you how the first response times vary over the hour of the day. You can identify the business hours when the response time is fastest and vice versa. Additionally, you can compare it with the ticket volume. Is the response getting slower due to any spike in the ticket volume? Is it slower due to the resource unavailability during the hour? Or simply, are your agents on time-out during that particular hour?
Multilevel graphs may sound complex, while in reality, HappyFox Business Intelligence can help you generate custom graphs in minutes.
5. Automate the Grunt Work
One way to drastically reduce the first response time is automation. With workflow automation tools like HappyFox Workflows, you could automate recurring processes in ticket management. You can also set up triggers to automatically notify stakeholders during times of SLA breach. As a result, your agents can drive focus where it matters, in major customer issues that require immediate attention.
Finally, As your customer service team grows, you should start gauging their improvement efforts objectively. Analyze the first response times over weeks, months, and years for a broader perspective. Because breakthroughs only happen over time.
First Response Time Best practices
- Utilize the fastest support channels like live chat.
- Encourage self-service with a knowledge base and chatbot to prevent ticket queues.
- Reduce multitasking. Allot necessary resources for improved agent productivity.
- Prevent burnouts by setting realistic expectations and targets.
- Automate recurring support processes to save time incrementally.
- Keep a constant tab on support performance and remove any inefficiencies then and there.
The Last Word
Better first response times drive better customer experience, enhance brand trust, control churn, and position your brand as customer-centric. The stakes are high — it’s time to make first response time your competitive differentiator.
HappyFox BI, a cutting-edge BI tool for modern customer support teams can empower you to make data-driven decisions and ensure maximum business value. Get a HappyFox BI demo to accelerate your analytics journey.