If your company provides active voice-based support through a call center software like Aircall, 8×8, Talkdesk or RingCentral, there’s a high probability that voice-based performance metrics are being tracked in some form or another. Companies that are earnest about creating solid and lasting support experiences establish KPIs and metrics for their voice teams which typically involves measuring agent-level and call-level indicators that lead to faster resolution times and better customer experience(CX).
If you’re managing your support team or reporting to a C-level executive, glancing through the data in your call center provider’s native reporting tool can be extremely time-consuming. In a worst-case where you don’t have access to call center data, you will not be able to actively make data-driven decisions that improve your call center performance and customer satisfaction (CSAT). These scenarios bring us to the following questions: What constitutes an ideal call center dashboard? What metrics or KPIs should I track? We’ll address these questions in this blog post.
Using Aircall as your Call Center? Click here to get started with HappyFox BI for Aircall in minutes.
What constitutes a call center dashboard?
Call center dashboards give support managers and CXOs the ability to view call center performance at a glance. Usually, there are two broad categories of dashboards that companies can build for their call center – Agent Performance and Call Center Performance. Most call center dashboards will allow you to choose a range of dates and filter the data by one or several agents to show you the indicators.
Call Center Dashboard Examples:
Call Center Performance dashboard:
Call Distribution Dashboard:
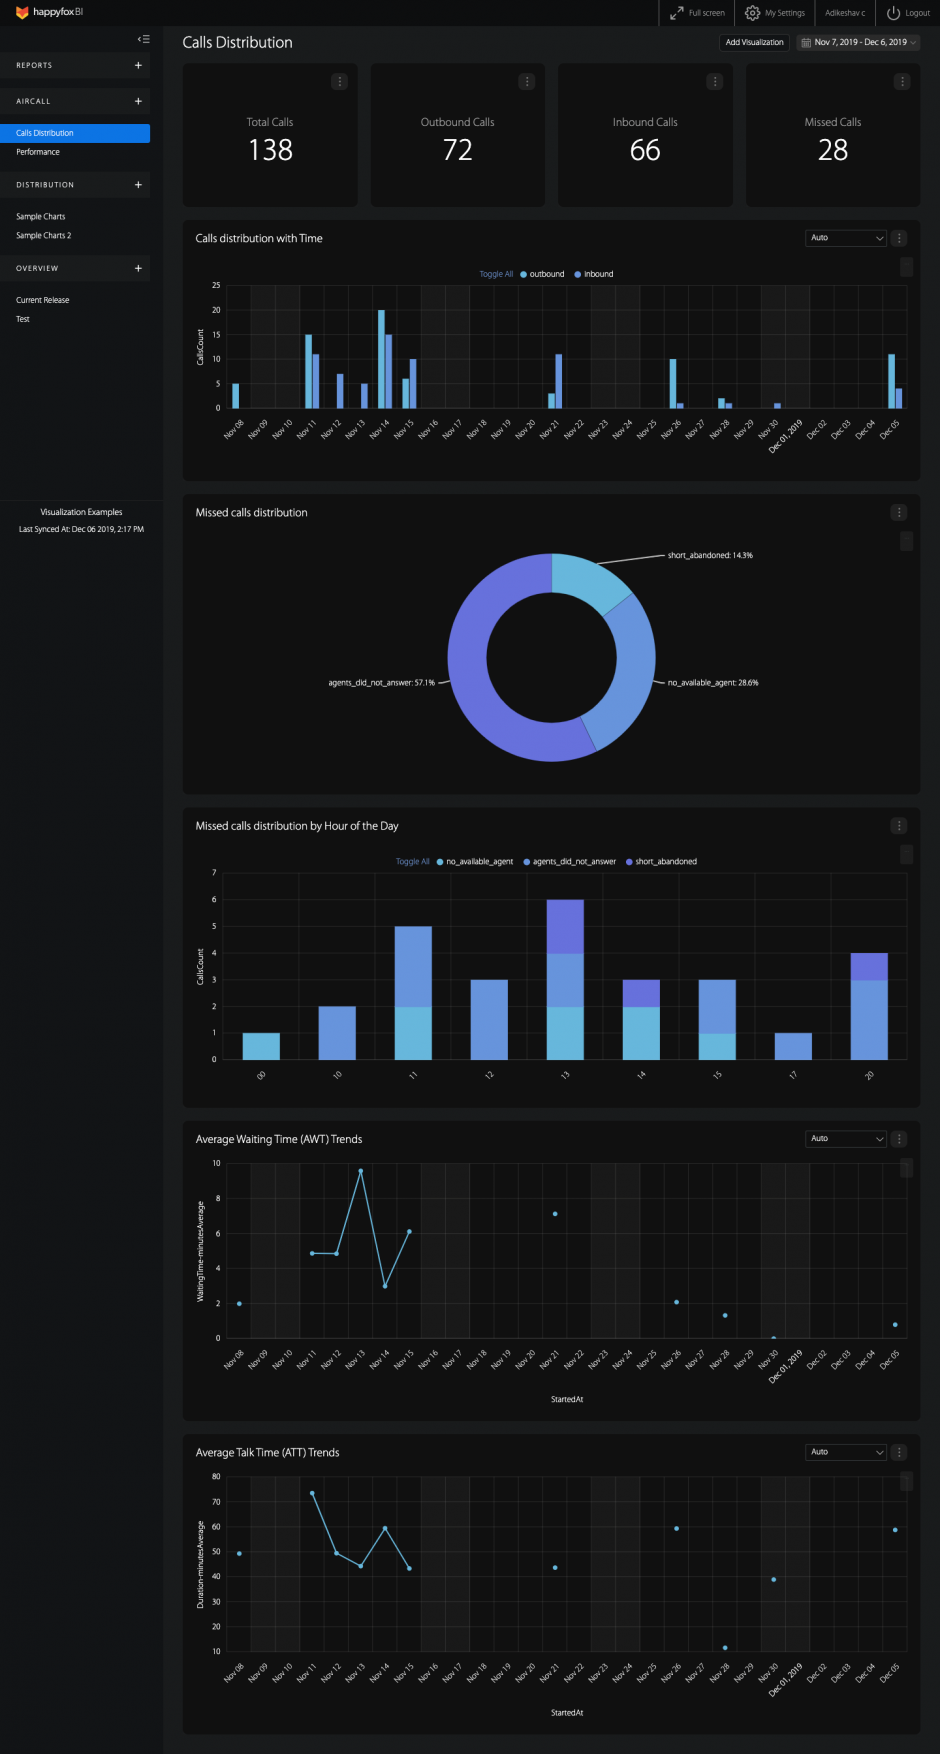
1. High-level call center statistics
High-level call statistics, usually represented in data tiles, lets you quickly glance at prominent call logs metrics that matter. These metrics represent the health status of your call center and is recommended to keep track of them from time to time for optimal call center functioning.
- Total Calls: Total registered calls.
- Outbound calls: Outgoing calls made by your agents.
- Inbound calls: Incoming calls answered by your agents.
- Missed Calls: Calls that were not picked by your agents.

2. Call center performance indicators
With call center performance widgets, you can check metrics with details about the calls made by the different phone lines of your call center. You can analyze the behavior of the calls in the period and the use of your phone numbers to detect the days and hours of the higher load for your call center. In the below example, you can quickly identify the hours in a day where there are a lot of missed calls, along with the missed call reason.

You can also see which hours have more activity, depending on the time of entry and exit defined in the report parameters. This data will allow you to determine if there are days when you have to extend your work hours.
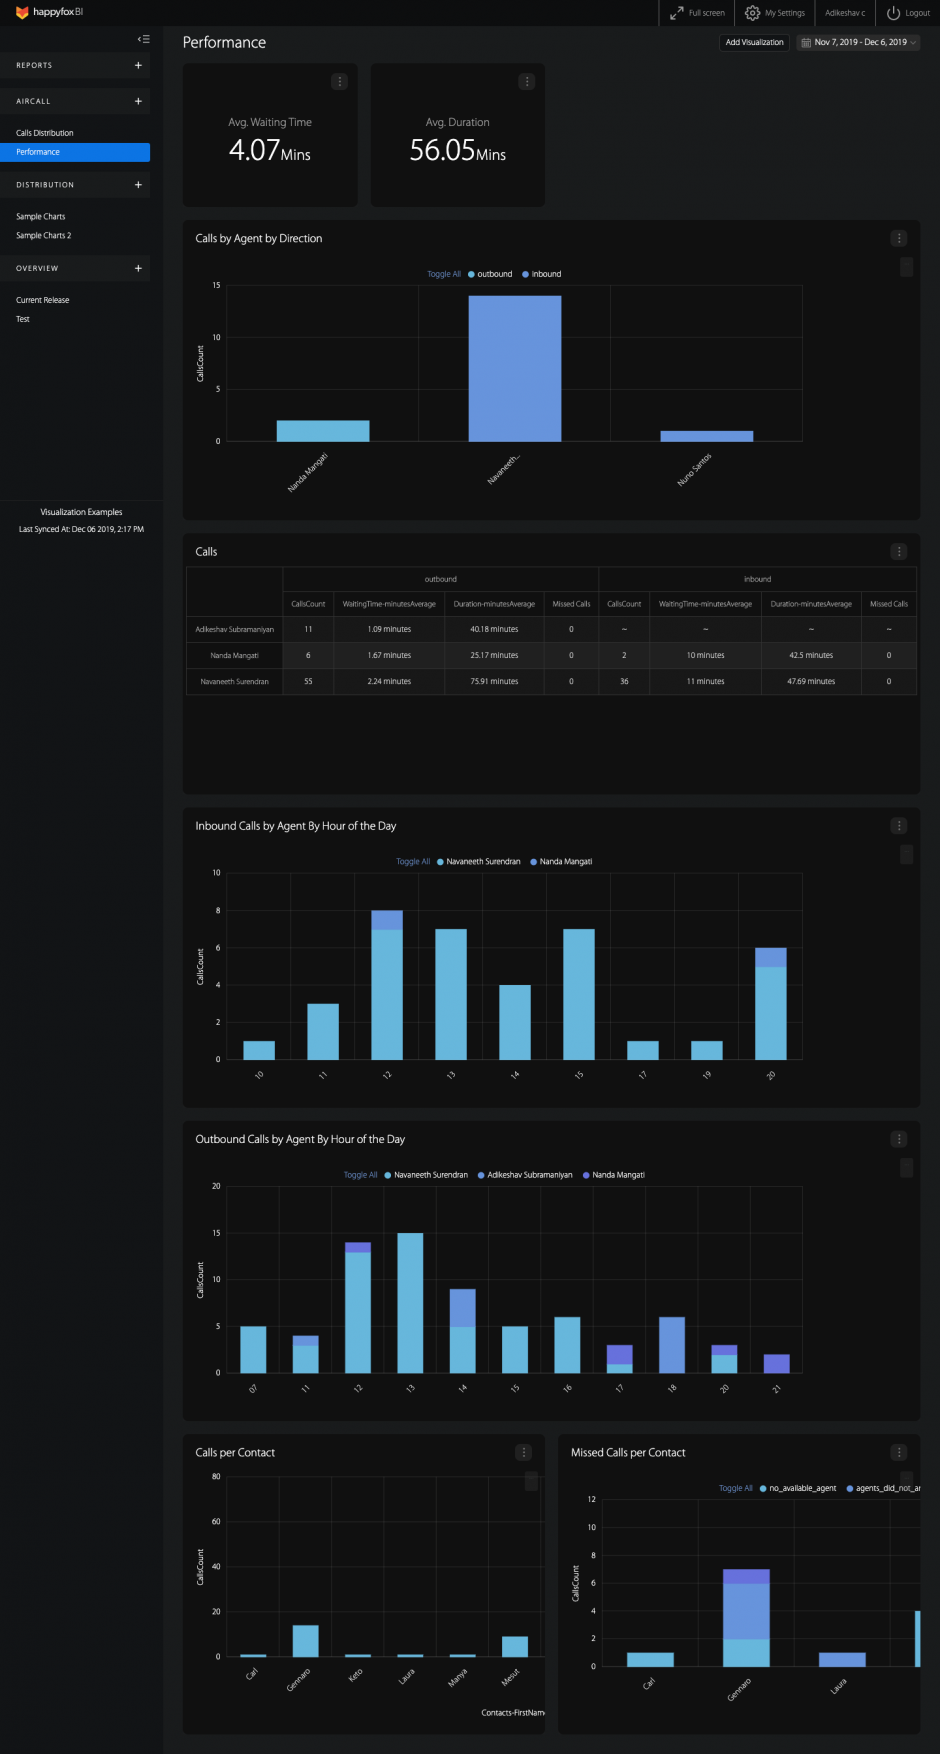
3. Agent Performance Indicators
Metrics and KPIs that correspond to how well your agents are handling calls is crucial to measuring the performance of your call center. A comprehensive pivot table that describes how different teams are faring with respect to call count, average waiting time, average talk time would be helpful to evaluate and benchmark team performance.

Better yet, you should also be able to deep-dive those metrics at a per-agent level, so that you can quickly identify high performing agents or agents who require training.

4. Average Wait-Time Trends
Average Wait Time (AWT) is the average time an inbound call spends waiting in the queue. In today’s era of fast-paced customer service, it’s important that the call center keeps up with that demand, with fast response times and minimal wait times.
The traditional call center industry-standard service level is 80/20, or 80% of calls answered within 20 seconds, though this number is considerably lower for modern call centers.

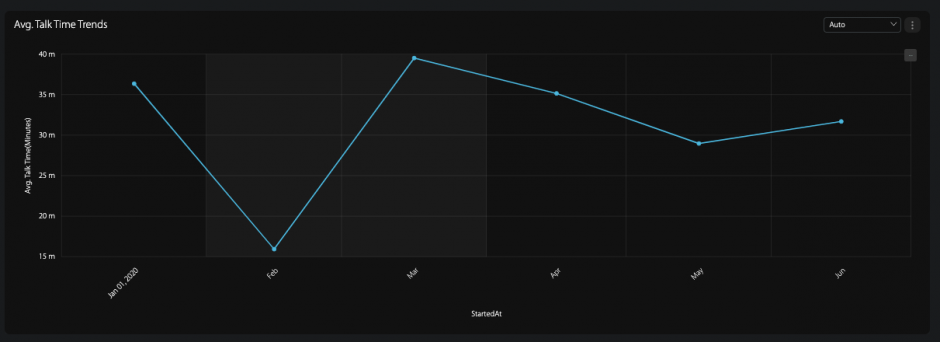
5. Average Talk-Time Trends
Average Talk-Time (ATT) is one of the most important customer insights, ATT is a representation of a customer’s exposure to your company’s representatives. By definition, Average Talk Time is, quite simply, the amount of time an agent spends talking to customers. Lengthy handling times are an indicator of a slow or over-complicated wrap-up system that requires retrospection. Through a time-based distribution of ATT, you can evaluate your call center’s performance across different time pockets and use the data to make informed decisions.
Conclusion
Call center dashboards help customer support leaders gain a quick understanding of how their phone-based teams are performing, down to the individual agents level. These dashboards provide insights that help with staffing and training, and the ability to view KPIs in real-time allows for faster decision-making, quicker resolutions, and better experiences for customers.
With HappyFox BI, you will be able to perform cross-functional reporting and analytics.Combine different data sources and create cross-functional reports. You get the tools and widgets in order to make the right decisions based on data and accelerate your organizational growth. Get a demo of HappyFox BI and get started your analytics journey.