Imagine being in a room where the lights are turned down and there is a white screen blinding you. Uncomfortable, right? Dark interfaces came up as a solution for easier screen viewing in low light conditions. Today, it’s fairly common for software to provide color theme options. There’s been a recent infusion of consumer-facing dark modes options in many software and applications including WhatsApp, GitHub, and Gmail.
Popular anecdotal reasons for switching between the dark and light modes often include that it is easier on the eyes or more aesthetically pleasing. In this post from HappyFox Design, we will explore how effective this feature really is.
The Science Behind Dark vs Light Modes
The human pupil acts as a door to the retina, through which light reaches the eye. Depending on the amount of light in the environment, the size of the pupil changes. So by default, when it’s dark and we’re taking in a brightly lit screen, the amount of light entering our pupils clashes with the environment, making the screen experience harsher. This is where the dark mode supposedly works its magic.
In users with normal vision, light mode leads to better performance most of the time.
Nielsen Norman Group article
This means that the traditional UIs with positive polarity actually lead to better legibility and perception of details for observers of all ages. This leaves us confused. Why are dark modes all the rage when research suggests that they don’t always offer any specific advantage?
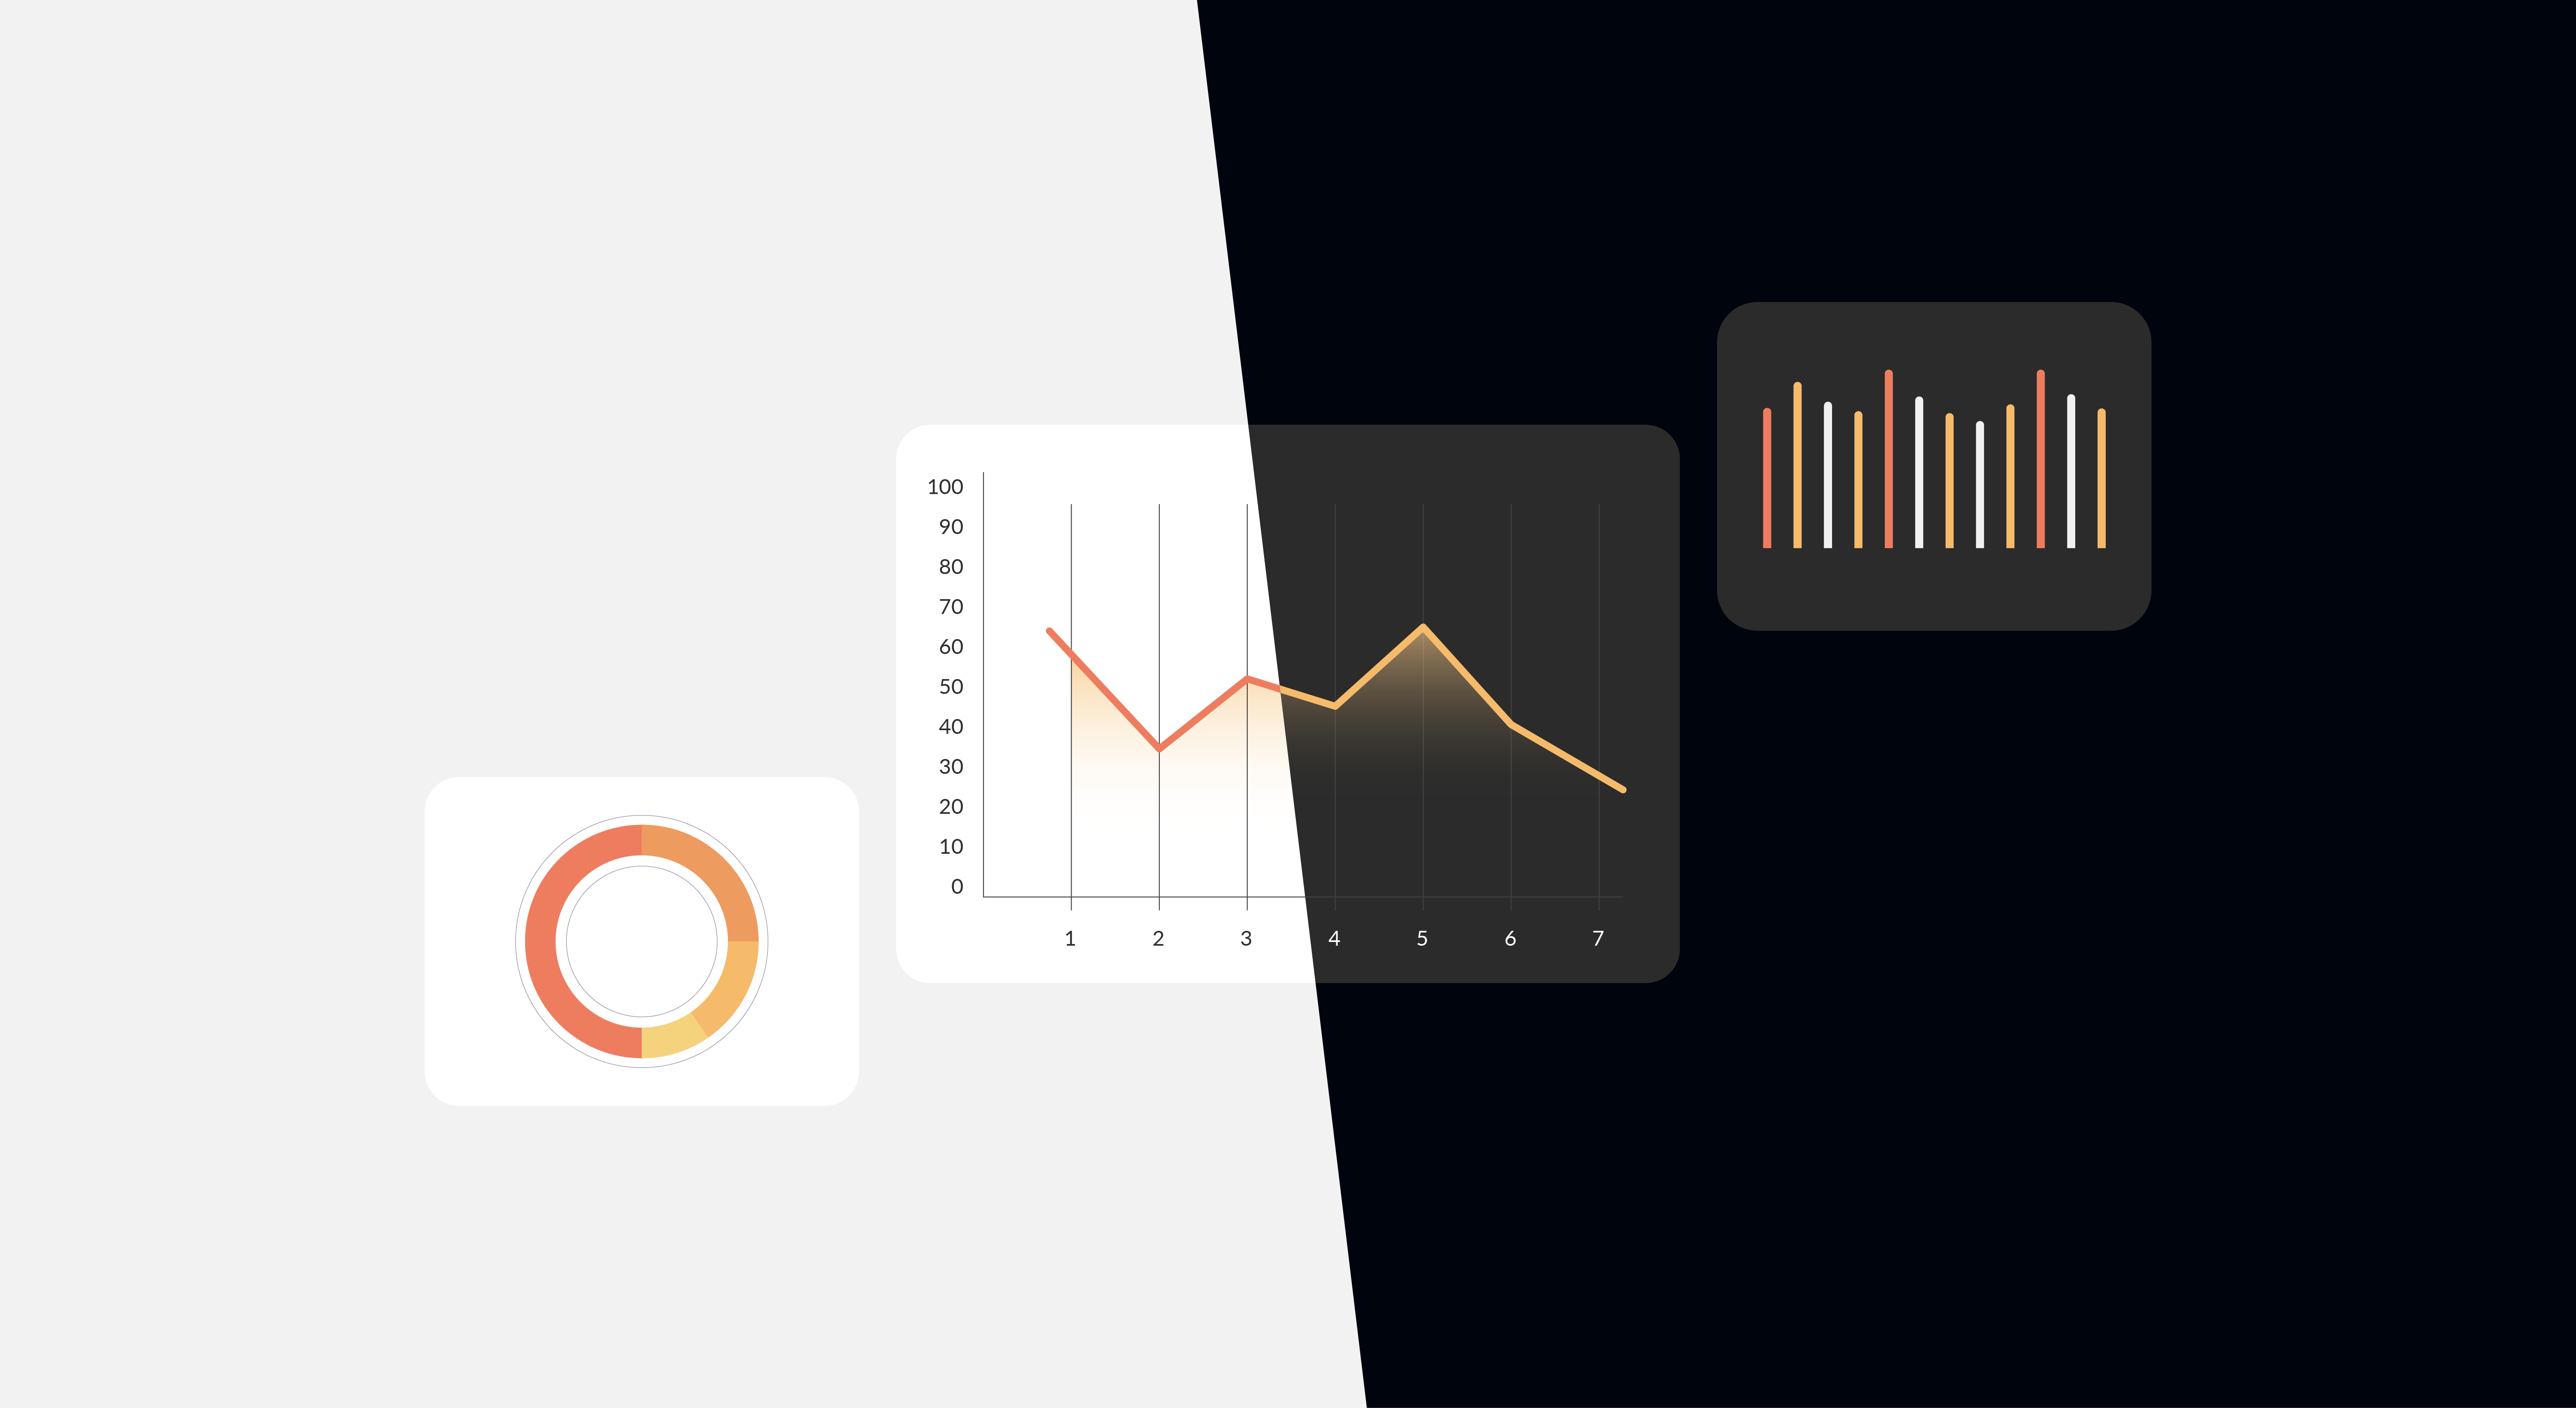
Dark Mode for Data Analysis
When used in the right context, application, and environment, dark background UIs make sense and are even advantageous. One instance when the dark mode usually works well is data visualizations.
Colors can make or break a data visualization, in fact, they have a deep-seated effect on how people feel about your product and how they perform on it. B2B dashboard and reporting software are often designed in a dark-themed UI and for good reason. For example, HappyFox Business Intelligence and Reporting software mostly deals with dashboards filled with data visualizations and is light on text. When the elements on the screen have sparse text with a strong emphasis on visuals, dark backgrounds are known to be successful.
Advantages of Dark Mode
1. Eliminates visual distractions
According to Apple’s human interface guidelines, dark mode helps important content to stand out while the surrounding UI recedes into the background as it is darkened. So it makes sense that an application like HappyFox BI uses negative polarity as its standard mode. Its main focus is on data visualizations, and the dark UI pivots the visuals by minimizing priority on the textual elements. In cases where content is viewed on large screens set up over 6 feet away from the viewers, dark mode helps eliminate distractions in the background.

2. Better visual ergonomics
Dark mode can help elevate visual ergonomics by reducing eye strain. It adapts to changing light conditions and provides ease of use in dark environments. Analytics pages are used for longer periods of time, so dark UIs are a great help in supporting visual clarity. It ensures that the data visualizations are easy to read and gain insights from.
3. Comfortable and effective data-driven decision making
Dark mode encourages viewers to scan through the visualizations like graphs, heat maps, and pie charts without getting fixated on secondary textual information. They help us dig through data and make sound decisions and future predictions more effectively.
When used in the right context, application, and environment, dark background UIs make sense and are even advantageous.
Light Mode in Data Analytics
Even though people don’t often change default settings, if the need arises, they should have the option to. Especially for a dashboard and reporting software that has frequent and periodic use, it is important to provide an option between dark and light modes to users to accommodate different preferences.
With this in mind, HappyFox BI also comes built-in with a completely functional light mode. Just like the dark mode, the light mode has a range of upsides.
Advantages of Light Mode
1. Improves reading comprehension
In the case of B2B applications that include long text and forms or mixed content on the screen, light UIs facilitate a more comfortable experience. This is because white reflects every wavelength on the color spectrum. Another contributing factor is that we are accustomed to viewing dark elements on light backgrounds.
2. Improves accessibility
During daytime or for environments with direct sunlight or light UIs are more effective. This is simply because the amount of light on the screen matches the brightness of the environment. Additionally, for people with astigmatism, light modes are decidedly the better option as they facilitate better focus.

Dark Mode vs. Light Mode: Which Is Better?
At the end of the day, it’s not so black and white! As with just about anything, the debate between dark and light modes can be put to rest with the conclusion that both have their advantages and disadvantages.
As any software expands and diversifies, it is prudent to also offer a light and dark mode. Doing so will give the users an option to view the content in their chosen polarity. HappyFox’s BI brings the best of both modes to the table. The choice between light and dark mode should be based on the context, application, and environment of the use case.
As any software expands and diversifies, it is prudent to also offer a light and dark mode.
HappyFox BI is a dashboard and reporting software that places its end-users at the forefront. Sign up for a demo with our product specialists to learn how it can help with your reporting needs.