The effectiveness of a help desk is directly a measure of customer satisfaction. But how do organizations achieve and measure this? Embracing a data-driven approach by tracking ticketing system metrics drives service excellence.
Gartner states over 70% of CX(customer experience) leaders struggle with customer loyalty. Homegrown systems, inefficient support practices, result in burnout and frustration.
Regardless of the support experience, tapping into data offers transparency, aiding process improvement. A ticketing system collects and organizes customer data, providing valuable insights. This enables businesses to offer proactive support experience minus complexities.
In this guide, we delve into the correlation of ticketing system metrics for customer satisfaction. We’ll also examine the key support KPIs businesses should track for efficient operations.
Key Pointers:
- What are metrics in a ticketing system?
- How does a ticketing system impact customer satisfaction?
- Improving ticketing system metrics – best practices
- Future ticketing metrics trends
Ticketing System Metrics – An Overview:
Ticketing system metrics measure how good your support is. They tell you what the current system lacks and what it excels in. This visibility helps businesses track and manage process gaps well.
They also help with resource allocation and setting the right goals. By looking at these numbers, organizations can make data-driven decisions. This eventually translates into improved response times, faster resolution and customer satisfaction.
Type of Ticketing System Metrics:
Ticketing system metrics cover varied aspects of support. From response to resolution time, CSAT to agent utilization rate, handle time to ticket backlogs, the list is comprehensive. Reviewing this data is crucial as it highlights the current state of the support in the organization.
Largely, these metrics fall under three different categories – based on what they measure. While one is a measure of efficiency, others track quality and volume of the support. Each of these categories assesses varied aspects, together contributing to overall support enhancement.
Let’s dive deep in:
Efficiency Metrics:
1. First Response Time:
Denotes the average time taken for a first response from an agent on a ticket. It is usually calculated as the average of first response times over a period. It is a crucial metric as it indicates the responsiveness of your support team.
An agent responding to a ticket created at 9:00 am by 9:15 is an example. In this case, it equates to a 15 minute response time for this ticket.
2. Average Resolution Time:
Refers to the average time taken to resolve a ticket. It includes wait times from both agent and customer’s side.
The metric indirectly equates to the efficiency of the resolution process. It also helps identify and eliminate bottlenecks in addressing issues.
It is calculated by summing up the resolution times to the number of tickets during the given period.
3. Average Handle Time:
Measures the average duration an agent spends actively working on a ticket, as tracked through updates in the ticketing system. This metric excludes idle periods and wait times, focusing solely on productive engagement.
Average Handle Time serves as a key performance indicator (KPI) to assess agent efficiency and identify areas where additional training may enhance the overall support experience.
4. First Contact Resolution Rate(FCR Rate):
Denotes the percentage of tickets solved within the first interaction. The tickets that are resolved in one instance fall under this category.
The metric determines the efficiency of the support team. The higher the FCR rate, the happier customers are.
First Resolution Time is calculated by adding up the number of tickets resolved in first contact to the total number of tickets during the period.
5. Ticket Backlog:
Refers to the pending tickets available at any given time. It is usually tracked with the help of a help desk ticketing system.
The metric reflects the current workload of the support team. It helps understand understaffing needs, leading to enhanced satisfaction.
Quality Metrics:
6. CSAT(Customer Satisfaction Score):
Measures the customer’s satisfaction with the support received. It is usually assessed with the help of customer satisfaction surveys.The metric is directly a reflection of support quality and highlights areas for improvement.
Example: How would you rate your experience on a scale of 1-5? Higher scores of 4 and 5 indicates happier and satisfied customers.
7. Escalation Rate:
Measures the percentage of tickets that require escalation to a higher level of support. A lower escalation rate typically indicates that front-line agents are well-equipped to handle most issues.
It helps identify training needs and potential gaps in knowledge or resources at the first level of support.
8. SLA Compliance Rate:
Measures the percentage of tickets resolved within the agreed-upon Service Level Agreement (SLA) timeframes. A higher compliance rate indicates that the help desk is consistently meeting its service commitments to customers.
It helps identify areas where response or resolution times need improvement and ensures the team is delivering service according to established standards.
9. Resolution Rate:
Indicates the percentage of tickets resolved across channels at a given time. This KPI identifies an organization’s effectiveness in addressing support requests. It is also a measure of the efficiency of the support team in meeting SLAs.
Let’s assume the number of tickets resolved and total number of tickets to be 80 and 100. The resolution rate here would be 80%.
10. Reopened Ticket Rate:
Refers to the percentage of resolved tickets reopened later. This metric assesses the inefficiencies in resolving customer issues precisely.
The higher the rate, the greater the need for training to improve support efficiency.
Curious to learn more about essential ticketing system metrics, check out this video tutorial.
Volume Metrics:
11. Ticket Volume:
Measures the total number of tickets received in a certain period. It is calculated by summing the number of requests received in the timeframe.
It is a great indicator of the overall support workload. Additionally, this is also beneficial in predicting trends, gaps for future enhancements.
12. Tickets per Customer:
Refers to the average ticket received per customer at a given time. This metric highlights the areas where customers require support.
This in turn can lead to proactive measures that improve overall experience.
13. Peak Hour Ticket Volume:
Indicates the ticket volume received by the support during peak business hours. The KPI aids in managing peak load with accurate staffing decisions.
It helps agents stay prepared to better handle issues with efficiency.
14. Channel Distribution:
Denotes the number of tickets received across varied communication channels. The metric guides businesses in optimizing support on every channel. This way support teams can better allocate resources optimally.
55% email, 20% chat, 15% phone, 10% social is an example to consider here.
15. Agent Utilization Rate:
Refers the time spent by agents in ticket-related activities – calls, conversation, issue resolution.
The metric highlights agents who are overburdened and underutilized. This assists in balancing agent workload with ticket inflow.
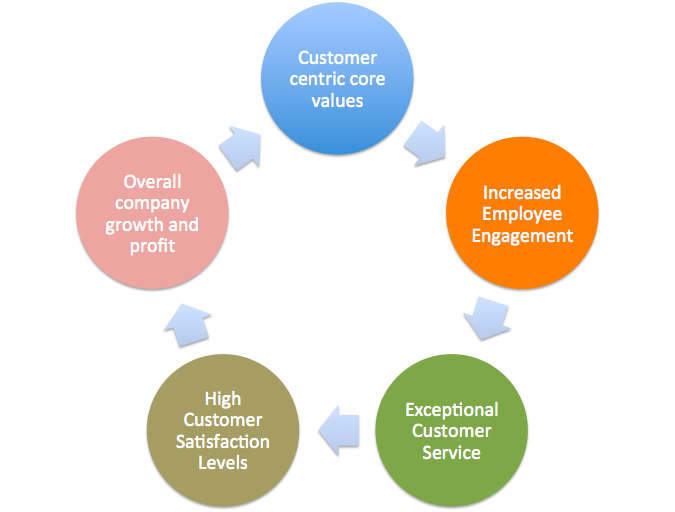
The Impact of Ticketing Systems on Customer Satisfaction:
Ticketing systems have a broader scope on enhancing customer satisfaction. An efficient ticket software handles customer issues in an organized manner. Automation, intelligent routing, self-service and AI capabilities contribute to enhanced service quality and experience.
Streamlined processes drive accurate responses, leading to faster response and resolution times. By focusing on these prime metrics, businesses can efficiently prioritize customer satisfaction.
Ticketing System Data Workflow
Gathering data accurately is crucial for effective decision making. A ticketing system built-in with data logging, automation, reporting features aid reliable data collection. This lays the foundation for measuring and reviewing ticketing system metrics. The overall process is vital for identifying patterns, trends and to improve business outcomes.
Let’s examine the workflow in brief:
Data capture and logging:
- Collects support data in the form of real-time ticketing entries.
- Helps track ticketing metrics like FCR, resolution rates automatically.
- Besides, it also integrates well with varied data sources – CRM, email.
Real-time data Visibility and Reporting:
- These ticketing metrics are populated into custom reports for better visibility.
- Doing so enables comprehensive data tracking for support enhancements.
- It also creates a reliable data repository for gap, trend analysis in the future.
CSAT in Ticketing Systems:
- Ticketing system enables post-interaction feedback via surveys.
- The CSAT scores thus derived facilitate support process optimization.
Given these capabilities, a ticketing system gathers and tracks data for enhanced support quality.
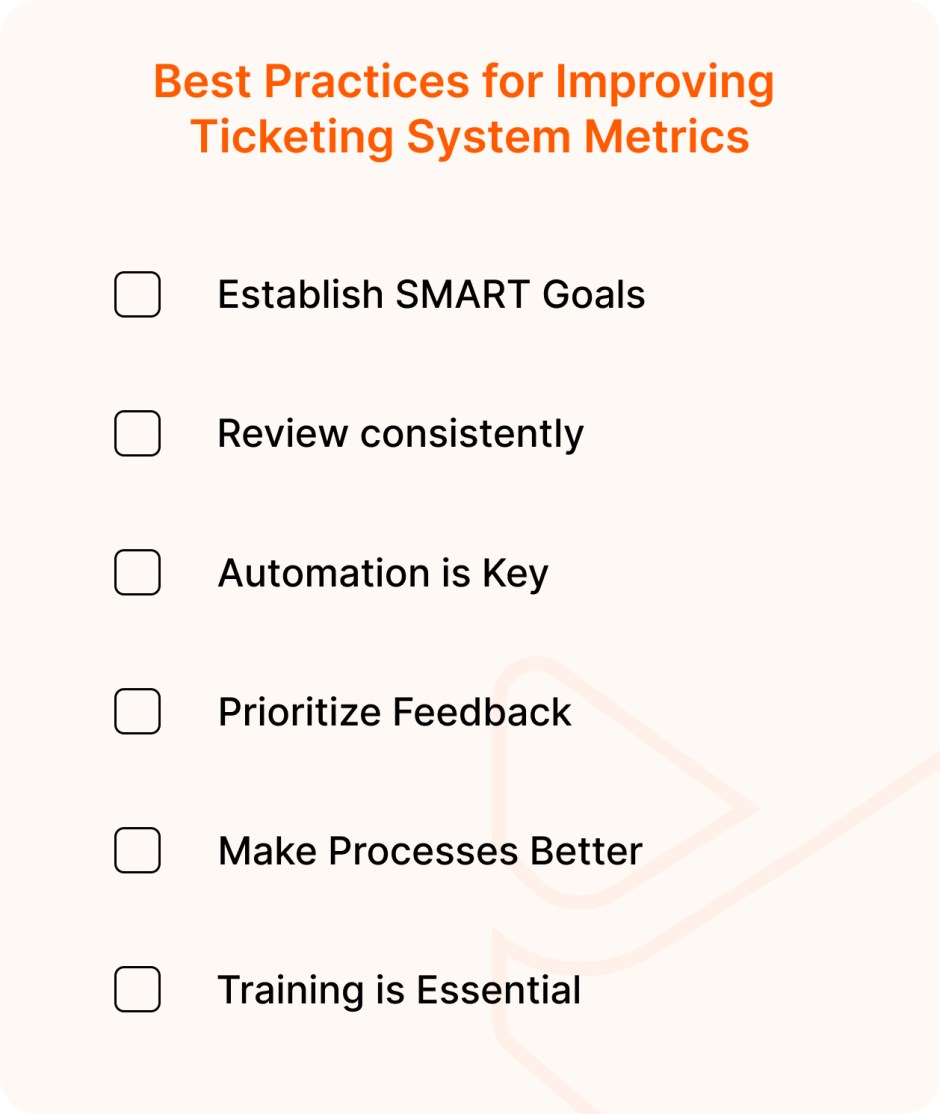
Best Practices for Improving Ticketing System Metrics:
Ticketing system metrics determine the way organizations offer support. Better handling of this data leads to positive experiences and improved service quality. In this section, we’ll discover key strategies to enhance the impact of support metrics.
- Establish SMART Goals:
Assess your current support processes and set SMART goals in place. If a higher ticket backlog is a roadblocker, work towards managing staff allocation. Potential goals could be higher customer satisfaction, higher FCRs, etc.
- Review consistently:
Revalidate your goals and metrics periodically for better support. Reviewing the data spots process shortcomings and aids aligning metrics with business needs.
- Automation is Key:
Work efficiently with automated processes for maximal benefits. Utilize automated techniques to assess and monitor metrics.
- Prioritize Feedback:
Rely on customer feedback and surveys to make the most use of data for efficiency. Prioritizing feedback guides business towards continued success.
- Make Processes Better:
Initiate practices that aim at making support better for agents and customers. Invest in tailored strategies like automation, AI, etc. They are crucial in reducing response and resolution times.
Implementing an AI-enriched knowledge base enables customer autonomy and self-resolution. This leads to faster resolution and a better experience.
- Training is Essential:
Invest in training support agents to utilize their maximum potential. These practices enhance their performance, quality leading to improved metrics.
Prioritize monthly/quarterly training sessions to initiate conversations among agents. Discussions on new features, common issues lead to better visibility and resolution.
Future Trends Driving Ticketing System Metrics:
Enhancing customer satisfaction with help of ticketing metrics is crucial. No matter the type of support, adopting a data-driven approach benefits businesses immensely. We’ll look at some trends that are posed to drive data-led transformation in support.
- AI-Led Ticketing: Tapping into AI-led ticketing leads to accurate sentiment analysis. This aids in predicting trends and strategies that enhance satisfaction.
- Live Insights: Ticketing systems in the future will offer live insights to address customer issues. With chatbots, AI sentiment in place, there is also scope of instant feedback collection.
- Tailoring Metrics: There isn’t one-size-fit all when it comes to ticketing metrics. Personalizing metrics to fit their customer journey will be the way forward. The approach allows for accurate review of customer loyalty and happiness.
- Enhanced Data Reliability: Sophisticated tools and techniques facilitate accurate collection of ticketing system data. Improved data capture ensures that businesses keep their CSAT scores higher always.
- Proactive Support: The more predictive the support, the better the customer satisfaction. The anticipative strategy keeps support teams better informed of the issues leading to a proactive experience.
Wrapping up:
In summary, implementing the right ticketing system metrics is vital for business continuity. Support data offers insights, paving the way for effective process optimization.
Make a note of the significance of varied ticketing metrics on all aspects of support. Review these practical strategies as you consider to refine your support metrics. Eventually, investing in the right data results in enhanced support and customer satisfaction.
Ready to make the most of support data for your business? Take a look at modern help desk ticketing systems to elevate your support experience.